
Moves, signals, and risks worth reviewing.
Research support · Not personalized financial advice.
Follow live signals through rates,
sectors, assets, and portfolio risk
in one visual flow.
Refreshing the latest market-flow snapshot.
Refreshing the latest market-flow snapshot.
Refreshing the latest market-flow snapshot.
Refreshing the latest market-flow snapshot.
Research support only. Not personalized financial advice.
Mave Signal turns 10-Q, 10-K and 8-K filings, market-moving headlines, commodity changes, macro data and company fundamentals into a daily bullish, neutral or bearish outlook.
 HI
Hasbro Inc
HAS
HI
HAS
Hasbro Inc
Neutral
+14.2%
12M expected return
Trending from 7 relevant headlines
HI
Hasbro Inc
HAS
HI
HAS
Hasbro Inc
Neutral
+14.2%
12M expected return
Trending from 7 relevant headlines
 VI
V
Visa Inc Class A
Bullish
+13.6%
12M expected return
Trending from 1 relevant headline
VI
V
Visa Inc Class A
Bullish
+13.6%
12M expected return
Trending from 1 relevant headline
 NC
NVDA
NVIDIA Corporation
Neutral
+12.4%
12M expected return
Trending from 19 relevant headlines
NC
NVDA
NVIDIA Corporation
Neutral
+12.4%
12M expected return
Trending from 19 relevant headlines
 TA
TBLA
Taboola
Neutral
+5.0%
12M expected return
Trending from 2 relevant headlines
TA
TBLA
Taboola
Neutral
+5.0%
12M expected return
Trending from 2 relevant headlines
Model-generated research, not personalized investment advice. Expected returns are estimates and are not guaranteed.
Track delayed 13F portfolio updates, research strategy baskets, daily and monthly return marks, and stock overlap signals in one research workflow.
Built for research and risk review, not copy trading. Tracker pages disclose benchmark, period, rebalance cadence, data assumptions, fees, slippage, drawdown, and survivorship-bias handling.
Daily market brief, Mave Thesis, headline impact, model output, and company fundamentals—built for research and decision support, not recommendations.

Review a transparent 12-month company thesis with model rating, valuation context, key drivers, and risks.

Scenario-based planning support for budgets, retirement, and goal assumptions. Research, not recommendations.

Review AI-driven context on how global news shapes market trends and company risk.

Explore fundamental watchlist candidates in every industry with transparent model output.
Review a transparent 12-month company thesis with model rating, valuation context, key drivers, and risks.
Review AI-driven context on how global news shapes market trends and company risk.
Explore fundamental watchlist candidates in every industry with transparent model output.

Model-based market outlook and scenario signals for the S&P 500, for research only.
Technical model output to help prioritize research and risk review across markets.
Companies Enlisted

Ratings Analyzed
Use the Mavefund Index as transparent model output for further research. Review component scores, missing-data warnings, and risk flags before making any decision.
Dive into 10+ years of technical and fundamental data on companies and seamlessly compare their performance with industry competitors.


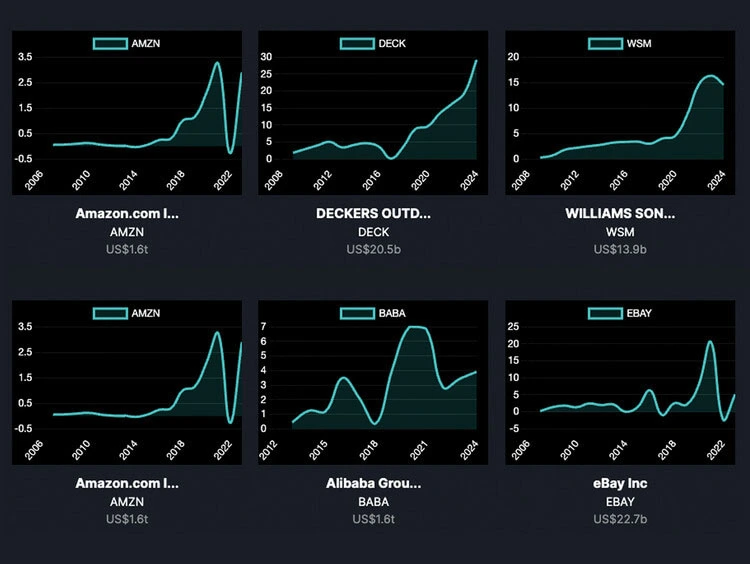

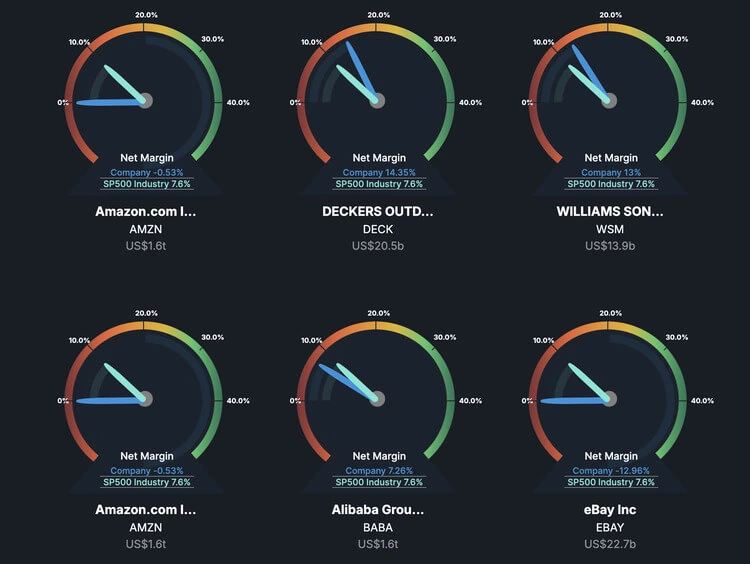
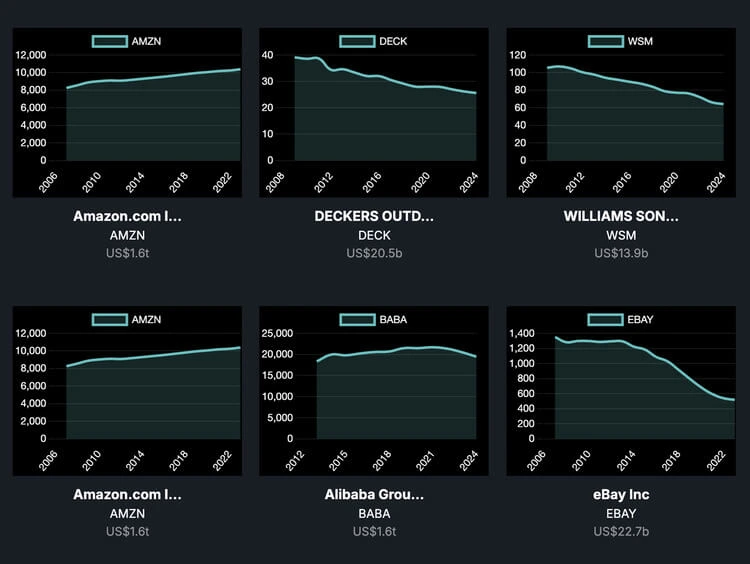
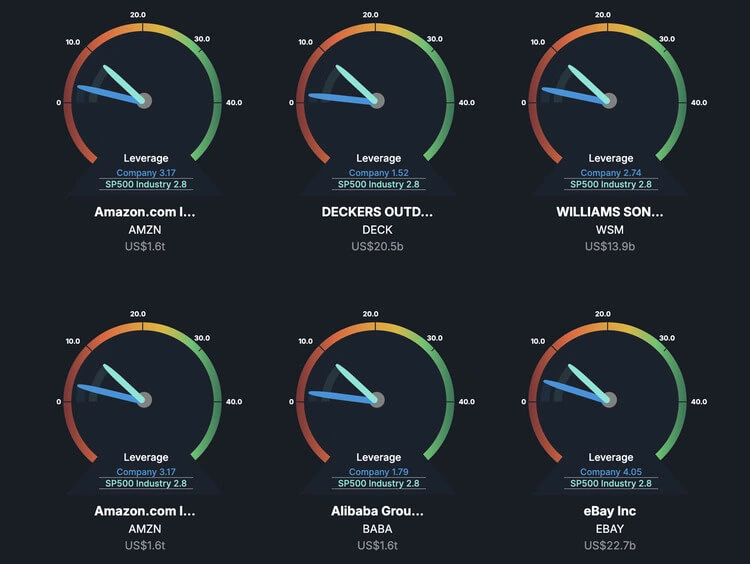
providing SEC EDGAR financial statements, company fundamentals, MaveScore context, and risk review data for your research workflow.
These are the priority pages we update most frequently for valuation, earnings, and risk trends.
Get the latest news and blogs to support research, watchlist building, and risk review.
Mavefund is built for self-directed investors who want daily market intelligence, transparent scores, company-level signals, and risk context before deciding what to research next.
Start with the daily brief: headline impact, sector moves, macro context, and affected companies.
Follow company pages and headline links to connect market events with fundamentals, filings, and recent signals.
Use watchlist candidates, MaveScore context, and signal tables to prioritize further review.
Review transparent score components, missing-data warnings, valuation context, and current market signals.
Look for drawdown context, sector exposure, recent headlines, model limitations, and company-specific risk flags.
Mavefund provides decision-support information. Investing involves risk, and historical model output is not a guarantee of future results.
Simplify your investment calculations by providing your monthly contributions, number of years, and expected annual return rate.